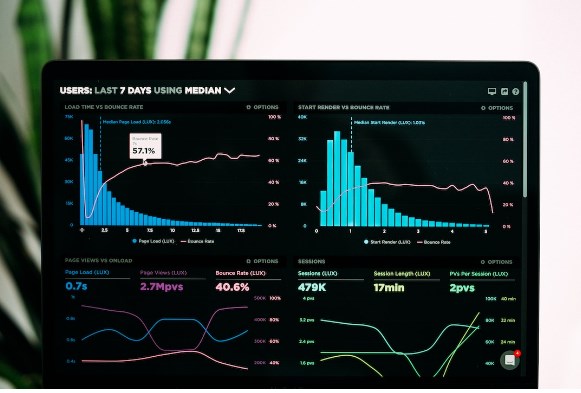
Are you struggling to comprehend complex data? Rarely does a solution beat the simplicity and utility of a bar chart. In this article, we’ll unfold the mystique of bar charts, explaining their basics, their functions, and superior scenarios of usage.
Understanding Bar Chart Basics
A bar chart, or a bar graph, is a type of data visualization tool that represents categorical data with rectangular bars. The lengths of these bars are proportional to the values they represent.
Bar charts provide a visual perspective that makes it easier to compare and contrast data points. The vertical axis usually depicts the measured value or frequency, while the horizontal axis lists the specific categories being compared.
From a statistical standpoint, bar charts aid in revealing patterns that help forecast future activity across different variables. It’s the simplicity and illustration capability that makes bar charts a favored choice in data visualization.
Delving Into the Mechanics of Bar Charts
Creating a bar chart is fairly straightforward. You have two axes – the x-axis (horizontal) and the y-axis (vertical). The categories of your data are listed on one axis, while the quantitative values are listed on the other.
By examining the length or height of the bars, an observer can quickly determine which category has the highest or lowest value. This straightforward design makes bar charts an outstanding tool for presentations or reports where clear, concise communication is critical.
It’s important to note that bar charts are best suited for displaying discrete data that can only take specific values as opposed to continuous data. This characteristic is the reason why you often find bar charts in surveys and polls analysis.
Insight Into Variety: Different Types of Bar Charts
Bar charts are versatile tools with several variations tailored to different types of data. The standard, or vertical, bar chart is the most common. However, there are other types of bar charts such as the horizontal bar chart, the stacked bar chart, and the grouped bar chart.

In a horizontal bar chart, values are displayed horizontally, which can be a more effective way of comparing individual values when you have long labels. Stacked bar charts are useful for comparing multiple categories and observing the total value of these categories.
Grouped bar charts simultaneously represent multiple series of data in a compact format. The bars representing different series are placed next to each other to facilitate a clear comparison.
Reading Between the Bars: How To Interpret Bar Charts
Interpreting a bar chart is as easy as reading from left to right or top to bottom. Start by looking at the title of the chart; it provides an insight into the information the chart seeks to communicate.
Next, observe the axes and their labels. The y-axis usually contains the data values, while the x-axis contains the category names. The length or height of the bars corresponds to the data value with the longest bar representing the highest data value.
In a stacked chart, each bar represents a total amount, broken down into sub-pound bars for each sub-group. In contrast, in the grouped column chart, individual columns represent sub-groups.
Overall, bar charts serve as fundamental tools in the arena of data visualization. Their easy construction and straightforward interpretation make them an ideal choice for representing diverse data in an alluring way. However, understanding their mechanics, variations, and ideal usage scenarios is key to maximizing their effectiveness.


